Price Action
Price
action trading is a strategy that helps predict market movements by spotting
patterns or ‘signals' in an underlying market's price movements.
In trading, what
is price action?
In
trading, price action examines a security's, index's, commodity's, or
currency's performance to forecast what it might do in the future. If your
price action analysis indicates that the price is about to rise, you may want
to take a long position; if you believe the price is about to fall, you may
want to short the asset.
Understanding
price action trading entails analyzing patterns and identifying key indicators
that may affect your investments. Many traders use a variety of price action
methods to predict market movements and make short-term gains.
The top seven trading strategies that
use price action signals
- Trend
based on price action
- Pin
bar Candle
- Inside
bar candle
- Trend
after retracement entry
-
Trend after breakout entry
- Head
and shoulders Pattern
- The pattern of highs and lows
Trend based on price action
Price action trend trading is the study of trends, whereas price action trading
is the study of price movements. Traders can use a variety of trading
strategies to identify and follow price action trends, such as the head and
shoulders trade reversal.
This
is an excellent trading tool for inexperienced traders because it allows them
to effectively learn from more experienced peers by chasing price action trends
as they emerge. In the screenshot below, you'd open a 'buy' position to take
advantage of the green uptrend’s, or a ‘sell' position to take advantage of the
red downtrends.
Pin bar Candlestick
The pin bar pattern, also known as the candlestick strategy due to its
distinctive shape, resembles a candle with a long wick. It denotes a sharp
reversal and rejection of a specific price, with the 'wick' or tail indicating
the price range that was rejected.
The
assumption is that the price will continue to move in the opposite direction of
the tail, and traders will use this information to decide whether to enter the
market long or short. For example, if the pin bar pattern has a long lower
tail, the trader knows that there has been a trend of lower prices being
rejected, implying that the price is about to rise.
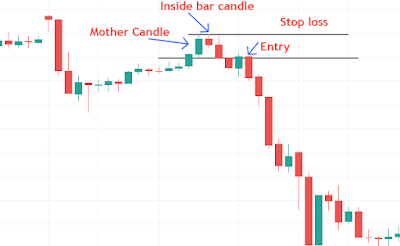
Inside bar candle
The inside bar pattern is a two-bar strategy in which the inner bar is smaller
than the outer bar and falls within the outer bar's high and low range (or
mother bar). Inside bars frequently form during market consolidation, but they
can also serve as a red herring, signaling a market turning point.
Skilled
traders can identify this trend at a glance and should be able to predict
whether the inside bar represents consolidation or a shift in the prevailing
trend using their macro knowledge. The size and position of the inside bar will
determine whether a price will rise or fall.
Trend after retracement entry
This is a straightforward price action strategy in which the trader simply
follows the current trend.
If
a price is clearly declining, with lower highs being created on a consistent
basis, a trader may consider going short. If prices are rising incrementally,
with highs and lows trending higher, the trader may want to buy in.
Trend after breakout entry
This trend follows any major market movements, assuming that a price spike will
be followed by a retracement. A breakout occurs when a market moves outside of
a defined support or resistance line.
Traders
can use this as a signal to enter a long position if the stock is trending
upwards or breaks above the resistance line, or a short position if it moves
below the support line.
Head and shoulders Pattern
The head and shoulders pattern, as the name implies, is a market movement that
resembles the silhouette of a head and shoulders. In other words, prices rise,
fall, rise again, fall again, and rise to a lower high before a small drop.
The
head and shoulders reversal trade is one of the most popular price action
trading strategies because it is simple to choose an entry point (generally
right after the first shoulder) and a stop loss (after the second shoulder) to
profit from a temporary peak (the head).
The pattern of highs and lows
Price action trading is fundamentally a game of highs and lows. Price action
traders can use the sequence of highs and lows strategy to identify emerging
market trends.
For
example, if a price is trading at higher highs and lower lows, it is in an
upward trend. It is trending downward if it is trading at lower highs and lows.
Traders can use their understanding of the sequence of highs and lows to select
an entry point at the lower end of an upward trend and set a stop just before
the previous higher low.


0 Comments